Thursday, March 26, 2015

Chart Attack


And just like that....all re-coupled.

SPX vs.  US10YT, / US30YT, HYG, USDJPY, EURJPY  except our friends in Germany vs. EUR 


SPX vs. US30YT


 ...And Zoomed In. This is where I'll be watching for clues as well as USDJPY.


 .... and possible projections if these two remain correlated.


With a look at the SPY: In order : Monthly, Weekly, 4 hour.


Tuesday, March 24, 2015

Miner Update

It's been quite the winter. Have been a bit busy and preoccupied, apologies for the lack of posts. Anywho, ever since gold put in that local top at 1300 its been a methodical and systematic take down, very technical if you've been watching/trading.

The real story still lies ahead. The rumblings continue to grow louder in various markets. The focus right now for me is on what lies ahead in the currency markets. I see gold as a currency so that fits well for me.

The miners took a nasty nose dive shortly after one of my prior missives in January when we looked at the ratios of gold:spx   gold:ndx  gold:spy   hui:gold.   We were banging up against the top rail of some down trending channels. Since then, we have reached the lower channel and now have begun to turn up. This is a great opportunity to buy the dips in the precious metals equities.

Here's one example of the charts; the rest can be recreated by typing into www.stockcharts.com "$gold:$ndx" for instance.


I like to look at these ratios to get an idea of relative strength among sectors and a sort of money flow perspective. The next chart that intrigues me the most is comparing the S+P 500
to the 20 year bonds. SPY:TLT (see below)


Since the start of 2014, bonds have been out performing the S+P500. The ratio has bounced off its 200dma 3 times now in this downward move.  I suspect there is more to come. I like the long bond over the S+P and gold over them all.
...
 Right when this ratio broke down, was right when the below chart lost its correlation. (SPX vs. 30YR US Treasury rate.)


I think this mostly signals volatility ahead as markets begin to shift again. 

As far as the miners go, they have some work to do in the charts to construct any major sea changes. Right now I continue to keep buying dips.  Going into tomorrow, we are in a peculiar spot for the immediate term, action for the next intermediate move will be determined shortly. I'll touch  base later this week or over the weekend with my thoughts.

Thanks for reading.


Wednesday, January 28, 2015

Miner Update

Really nothing to update here. The price action in the miners is acting very bullish. Bearish patterns have not been playing out with the same intensity from prior rallies. I believe we are going to trade higher and I think the silver miners are going to out perform. Will be monitoring that as we develop off these lows. I still won't be convinced though until gold is over 1400 steadily before I can really trust this turning into a new bull market. Until then, its just another big rally.I think gold is going to attack the 1340/50 range before we get a correction in the miners.


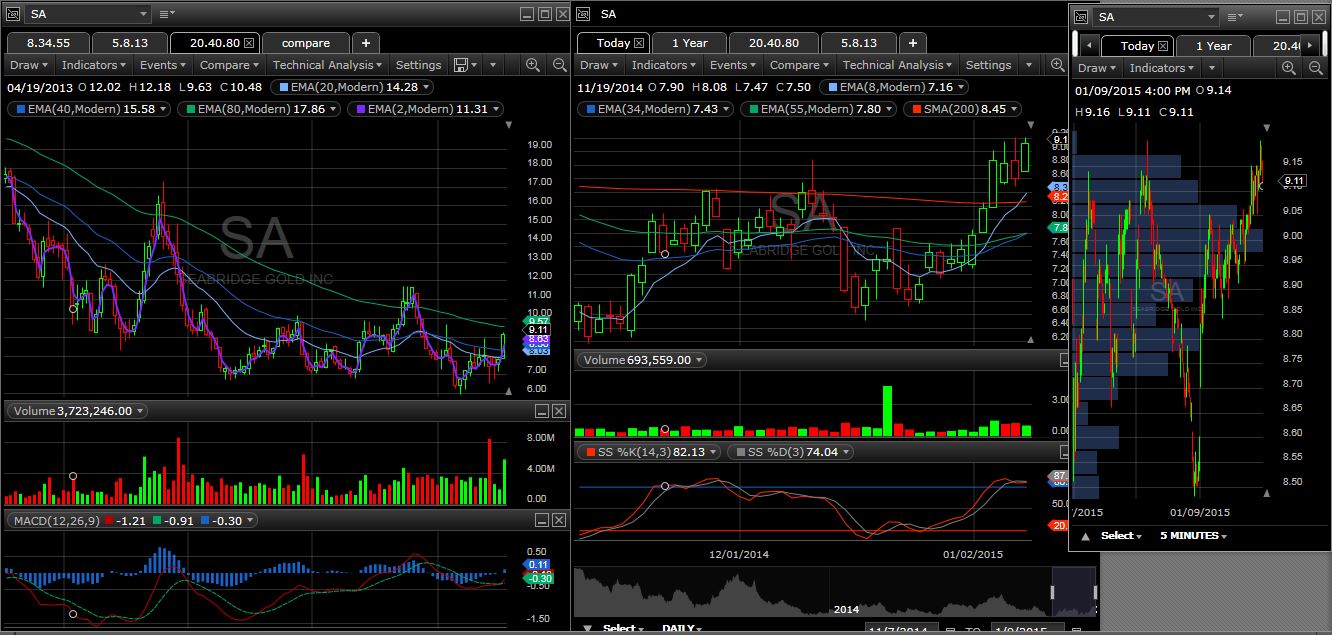
SA:
HL: Look at that slope of the 2week EMA and the MACD!


Friday, January 16, 2015

Chart Attack

This is probably the last place you'll find yourself for research and market commentary, but I put my commentary and analysis into this writing for myself and my personal trading/investing strategies. I use this forum as a daily journal to share with the world wide web. You don't have to agree with me or trade with me in my direction. That is the beauty of the market, everyone has a different time frame, opinion, need for capital, etc.

With that being said; I bid you adieu to my charts: Happy New Year and good luck this year. You'll need it.


Gold...The best performing currency in 2014...#2 actually. "USD" was better. (due to JPY, EUR weakness)

Gold in EUR: = breaking out


 Keep in mind of these below charts...Gold still has a lot of work to do against other benchmarks before a major break out.


 As far as the broad markets go... . Overvalued and overbought. There are pockets of value still remaining out there. Some solid signal names. If you aren't willing to do your homework and dig around, don't bother investing in the general indices.

GDX/GDXJ Chart updates:

Weekly view: 


SPY: "The market’s price to sales ratio is at an all-time high, the market capitalization to GDP ratio (Warren Buffett’s favorite indicator) is the second highest in history…. The Shiller Cyclically Adjusted P/E Ratio for the S&P is 27. That level has been exceeded only two times before – in 1929 and 2000."


I'll be looking to post these next 2 charts on this blog until oil finds its way,


I've continued to say that the bull market in gold will resume when a couple criteria are met: 1.) gold and the dollar rise in tandem. This is what we've seen as of late. 2.) Gold regains 1400.  


https://www.bullionstar.com/blog/koos-jansen/guest-post-i-have-a-theory-on-the-swiss-franc/


Sunday, December 28, 2014

Year in Review. The short version.

The fed influences market sentiment, period, end of story.

I'm not talking about outright manipulation or the plunge protection team, I'm saying that the big money, the money that matters and the big flow; their sentiment, is influenced by the fed. Which in turn drives the shorter term direction of the market. Some hacks on Twitter call this lazy thinking, it's not. It's simple. Play the game they play and you'll do just fine out there.

Another year in the books and double digit returns for the broad markets. If everything is so peachy, then why is the fed funds rate still in emergency mode at 0%? The macro theory is frozen in time as long as those rates never rise. The fed knows this, so can ZIRP remain around for many years more? I saw a long term chart of rates dating back to like 1800 and it showed periods where rates were near zero for l0-14 years. I'm just spinning the wheels here, but i wonder what debt to gdp was during those times lol. If anyone has any data on this shoot it my way! So with rates locked at zero the fed thinks they'll be able to slowly raise rates just so they have ammo to lower them when equities make the heaven forbid correction.
My advice for investors in 2015 is micro thinking, the broad markets are garbage but there are pocket of value still out there, just need to do some digging.
I am not capitulating on my macro views, time is on my side and buying the broad markets up here at these levels won't produce great returns over 10 year period. Maybe if the equity markets get a bloody correction and a good and healthy one, maybe I'd resume my allocations.

I was wrong in 2014, and that just gave me more time to accumulate. I anticipate another choppy, non directional move in 2015 in the precious metal arena with modest gains when all said and done.

The theory continues to be; resumption of the bull market in tandem with a strong dollar will be the tell. I want to see the PMs and gold rise together similar to the start of this market in  1999. On top of that the big $$ will be sidelined until 1400 is taken out and held.

Until then. I remain on course.

No charts on this review.  Will post a chart attack update early in the new year.

Have a Happy New Year.

Monday, December 1, 2014

Market is Talking

Time to begin looking for the exits in the domestic equity markets. Something is a 'brewing.   I have a slew of data and back up supporting my current view of running for the hills; if you haven't already. The move in oil and the recent price action in the commodities market (oil down 40% or so in 3 months),  the past few days in the precious metals market ; -10% then up 15% in silver in 3 days. The market is giving its signals; (what's left after the Fed has taken every other signal away).  Seasonally speaking; December is very rarely a 'crash/correction/pull back' month; positioning, year end, bonuses, etc. Money managers won't go making large changes or take on any additional positions that aren't in a confirmed uptrend.  I think the individual investor can make some excellent moves during this time because we are not constrained by SEC reporting, holdings and meeting quarterly benchmarks. 

I'll be posting more charts over the next two days or so on here;

For starters; on my India call; check out the visual of these ratios: stockcharts.com (type them in; or copy and paste)

ewz:eem
rsx:eem
indy:eem
fxi:eem
eza:eem

Which one looks better? That's right. Get long, get strong. BTFD.

To be continued: