Wednesday, September 9, 2015

The market lulled everyone to bed

And then it woke up while they were sleeping.

Shanghai Composite: Saved by the weekly Ichi but lots of bearish messages from the Ichimoku here.


Nikkei: Saved by the weekly Ichi but lots of bearish messages from the Ichimoku here.


My views on the SPX:


The writing has been on the wall for the past 12-18 months to stay away from US Domestic equity markets. High Yield , for one was screaming at whoever was willing to listen, now that we have caught down to HYG , all eyes on the FOMC . Now, the first SPX to HYG chart shows the hourly view over the YTD. I use this view because the correlation on the Daily view back to 2008 still has a correlation of .8 which is very strong, so then we can narrow the view and look at the hourly frame for more clues to direction of the market in shorter time frames.

There is more pain to come, it will pay to remain on sidelines or stay short. As we enter the crash prone season of the stock markets. I’ll be looking to cover shorts and nibble long as we end October and make the year end push.

The market is excellent at shaking out traders during a wedge. Below are two views of the SPX hourly through this decline from the choppy toppy action. Lower one includes indicators. 


And then there is the SPX update I had sent around on Monday. The 1950 stops were clearly ran. However with the late day push by the bears we regained 1950 and pushed the air pocket down to 1940. As I'm writing, futures gapped down and are breaking down out of the wedge. My downside targets are noted on the charts in the 1770-1800 range. That will be an area to watch to nibble long/cover shorts.


 And the long term weekly view. Doesn't look pretty with the Ichi cloud being broken.


Stay alert out there.

Matt


Thursday, June 25, 2015

It's been a while

The USA is the "wealthiest" country right? If we are going to remain an empire, we are going to have to convert fast enough to renewable energy before the rest of the world. Solar, wind, water, nuclear are going to be the drivers. There is enormous amounts of money pouring into all of these sectors. I'll be including this topic in my posts going forward. For now, let's touch base on a few things.

First,

Apologies for the delay in writing. I'm pursuing the Chartered Market Technician exam, which explains a small portion of my absence in continuing this shared journal of my thoughts on the market. Aside from the CMT, I've been trying to wrap my head around what I can and can't share via my views of the market from compliance at work. It's unreal how much compliance and regulation that is coming to trading desks globally.

My views are my views and my views only. Period.

Alright, lets get started.

 Below is a series of charts I am watching and will be discussing as they play out.

For this post; here are the charts, and I will elaborate individually as we progress.

XAU/XAG vs SPX


My thoughts on 10 year yields: Going no where, but everywhere.


My thoughts on near term spoos: expiry over this chart is over 2120.


Golds vs Inverse Nikkei


China....Love it.


Smart index vs. NYA vs. Bloomberg comfort index: dates on chart.


Dow:gold vs dow


Trannies:Industrials vs SPX


2s30s vs SPX


Gold/Bonds (inv.30yr yield) vs Gold


CRB:TLT vs Gold


Bonus Chart

LSG going higher.


Thursday, March 26, 2015

Chart Attack


And just like that....all re-coupled.

SPX vs.  US10YT, / US30YT, HYG, USDJPY, EURJPY  except our friends in Germany vs. EUR 


SPX vs. US30YT


 ...And Zoomed In. This is where I'll be watching for clues as well as USDJPY.


 .... and possible projections if these two remain correlated.


With a look at the SPY: In order : Monthly, Weekly, 4 hour.


Tuesday, March 24, 2015

Miner Update

It's been quite the winter. Have been a bit busy and preoccupied, apologies for the lack of posts. Anywho, ever since gold put in that local top at 1300 its been a methodical and systematic take down, very technical if you've been watching/trading.

The real story still lies ahead. The rumblings continue to grow louder in various markets. The focus right now for me is on what lies ahead in the currency markets. I see gold as a currency so that fits well for me.

The miners took a nasty nose dive shortly after one of my prior missives in January when we looked at the ratios of gold:spx   gold:ndx  gold:spy   hui:gold.   We were banging up against the top rail of some down trending channels. Since then, we have reached the lower channel and now have begun to turn up. This is a great opportunity to buy the dips in the precious metals equities.

Here's one example of the charts; the rest can be recreated by typing into www.stockcharts.com "$gold:$ndx" for instance.


I like to look at these ratios to get an idea of relative strength among sectors and a sort of money flow perspective. The next chart that intrigues me the most is comparing the S+P 500
to the 20 year bonds. SPY:TLT (see below)


Since the start of 2014, bonds have been out performing the S+P500. The ratio has bounced off its 200dma 3 times now in this downward move.  I suspect there is more to come. I like the long bond over the S+P and gold over them all.
...
 Right when this ratio broke down, was right when the below chart lost its correlation. (SPX vs. 30YR US Treasury rate.)


I think this mostly signals volatility ahead as markets begin to shift again. 

As far as the miners go, they have some work to do in the charts to construct any major sea changes. Right now I continue to keep buying dips.  Going into tomorrow, we are in a peculiar spot for the immediate term, action for the next intermediate move will be determined shortly. I'll touch  base later this week or over the weekend with my thoughts.

Thanks for reading.


Wednesday, January 28, 2015

Miner Update

Really nothing to update here. The price action in the miners is acting very bullish. Bearish patterns have not been playing out with the same intensity from prior rallies. I believe we are going to trade higher and I think the silver miners are going to out perform. Will be monitoring that as we develop off these lows. I still won't be convinced though until gold is over 1400 steadily before I can really trust this turning into a new bull market. Until then, its just another big rally.I think gold is going to attack the 1340/50 range before we get a correction in the miners.


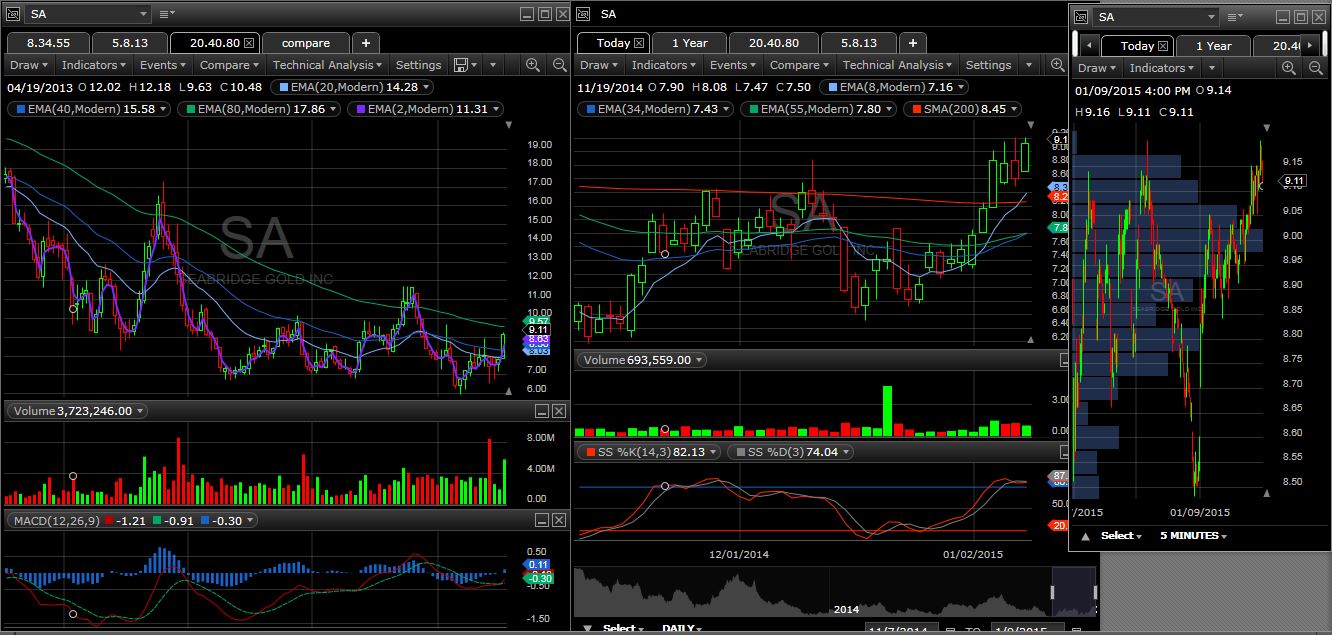
SA:
HL: Look at that slope of the 2week EMA and the MACD!


Friday, January 16, 2015

Chart Attack

This is probably the last place you'll find yourself for research and market commentary, but I put my commentary and analysis into this writing for myself and my personal trading/investing strategies. I use this forum as a daily journal to share with the world wide web. You don't have to agree with me or trade with me in my direction. That is the beauty of the market, everyone has a different time frame, opinion, need for capital, etc.

With that being said; I bid you adieu to my charts: Happy New Year and good luck this year. You'll need it.


Gold...The best performing currency in 2014...#2 actually. "USD" was better. (due to JPY, EUR weakness)

Gold in EUR: = breaking out


 Keep in mind of these below charts...Gold still has a lot of work to do against other benchmarks before a major break out.


 As far as the broad markets go... . Overvalued and overbought. There are pockets of value still remaining out there. Some solid signal names. If you aren't willing to do your homework and dig around, don't bother investing in the general indices.

GDX/GDXJ Chart updates:

Weekly view: 


SPY: "The market’s price to sales ratio is at an all-time high, the market capitalization to GDP ratio (Warren Buffett’s favorite indicator) is the second highest in history…. The Shiller Cyclically Adjusted P/E Ratio for the S&P is 27. That level has been exceeded only two times before – in 1929 and 2000."


I'll be looking to post these next 2 charts on this blog until oil finds its way,


I've continued to say that the bull market in gold will resume when a couple criteria are met: 1.) gold and the dollar rise in tandem. This is what we've seen as of late. 2.) Gold regains 1400.  


https://www.bullionstar.com/blog/koos-jansen/guest-post-i-have-a-theory-on-the-swiss-franc/